Based on the time that I have had the Renpho Smart Scale, I can honestly say that I have enjoyed using it. Instead of weighing myself once a week, I switched to weighing myself monthly. In this post, I am reviewing the Renpho Smart Scale application.
The Renpho Scale application
The Renpho Scale application gave me a lot of excellent information about where I stand. It breaks down into categories with basic info that explains the percentages of my weight. Below is a list of the categories that can be found on the application.
- Body Weight – Refers to a person’s mass or weight.
- Fat-free weight – This is the weight that a person has that is not fat
- Metabolic Age – The age of the body but not the length of time that a person has been alive
- BMI (body mass index) – Measurement of the height and weight to divide it into kilograms
- Subcutaneous Fat – Fat that is stored right up under the skin
- Body Fat – Total percentage of fatty tissue in the body
- Bone Mass – Bone density, tissue, per until volume of bone
- Muscle Mass – All muscle weight including the heart, other cardiac muscles, smooth, and skeletal muscle
- Water weight – Essentially all body fluids that give a combined percentage of water in the body
- Visceral Fat – Found under the muscle, around the organs, and in the abdomen cavity
- BMR (Basal Metabolic Rate) – The inactive state of energy
- Protein – There needs to be a sufficient amount of proteins in the body to build and maintain muscle, hormones, cells, tissue, and their growth.
- Skeletal muscle – The system works with the mechanical system of the limbs to allow movement
Body Weight
Body weight total refers to a person’s mass or weight. If you like a visual of where you stand for the percentage. Then you can tap on the block that you would like to look at. A drop-down bar will appear with a few different colors. Under the weight percentage of colors like blue, green, yellow, and red. These colors give you an idea of where you are. Along with where you should be.
- Blue – Underweight
- Green – Normal weight
- Yellow – Overweight
- Red – Obesity
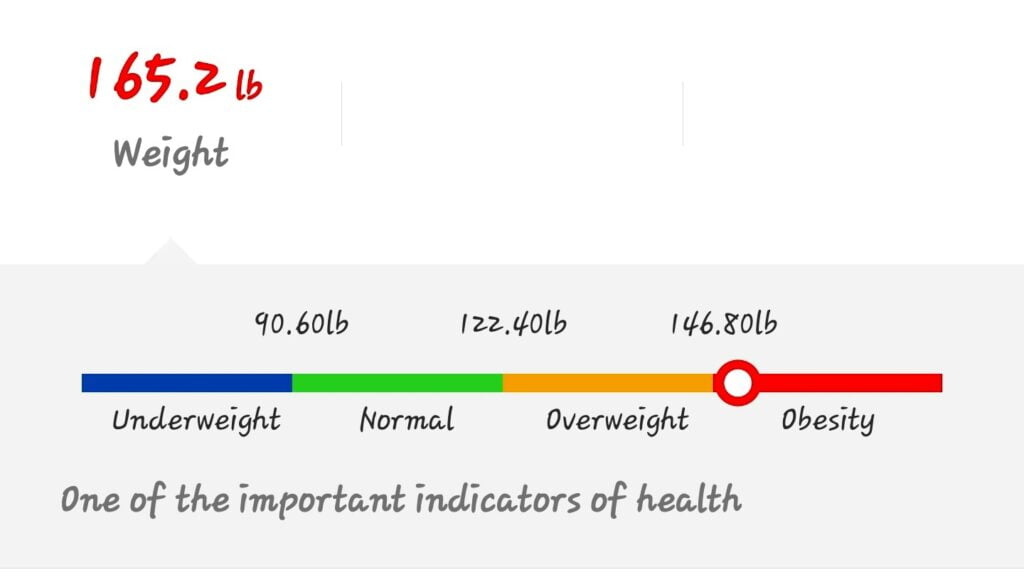
- 90.60lb and above is Normal
- 122.40lb and above is Overweight
- 146.80lb and above obesity
BMI
BMI (Body mass index) is the measurement of the height and weight to divide it into kilograms. The BMI colors for the percentages are the same as the weight, but the measurements differ. Check out this “Body Mass Index (BMI) Calculator” to find out what is your BMI.
- Blue – Underweight
- Green – Normal weight
- Yellow – Overweight
- Red – Obesity

- 18.5 above is Normal weight
- 25.0 above is Overweight
- 30.0 above is Obesity
Body Fat
Body fat is the totaled percentage of fatty tissue in the body. Body fat includes subcutaneous and visceral fat. A healthy fat percentage for a lady is 10 to 13% and for a man, the fat percentage should be 2 to 4%.
This is also based on age. For example, for a 30 to 39-year-old woman, the fat should be 17.5 to 20.8%. For a Man aged 30 to 39 with a body fat percentage of 14.6 to 18.2%. Both for women and men, these fat percentages are considered good.
- Blue – Essential Fat
- Dark Green – Athletes
- Lightest Green – Fitness
- Off Green – Acceptable
- Red – Obesity
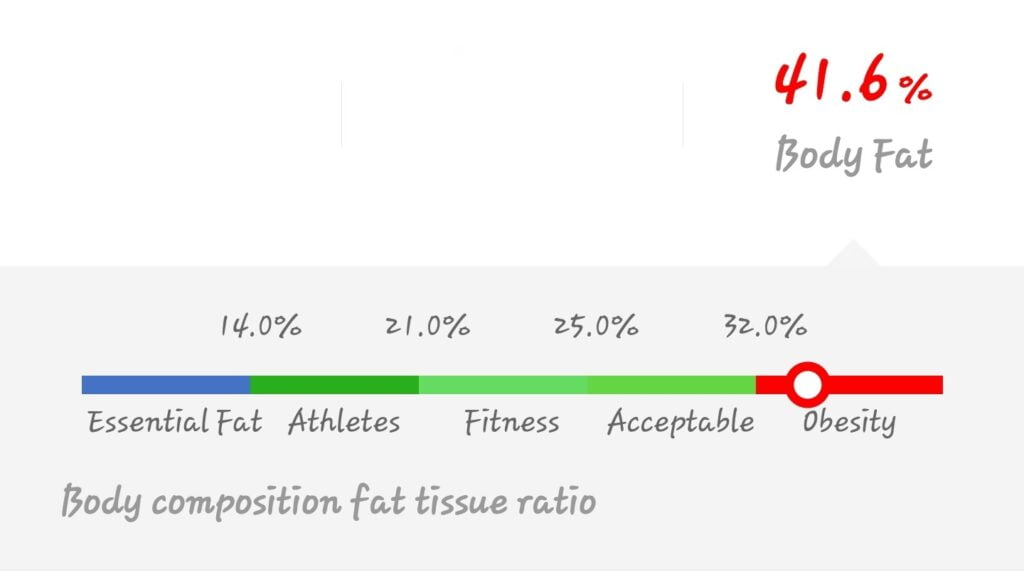
- 14.0% above is Athletes
- 21.0% above is Fitness
- 25.0% above is Acceptable
- 32.0% above is Obesity
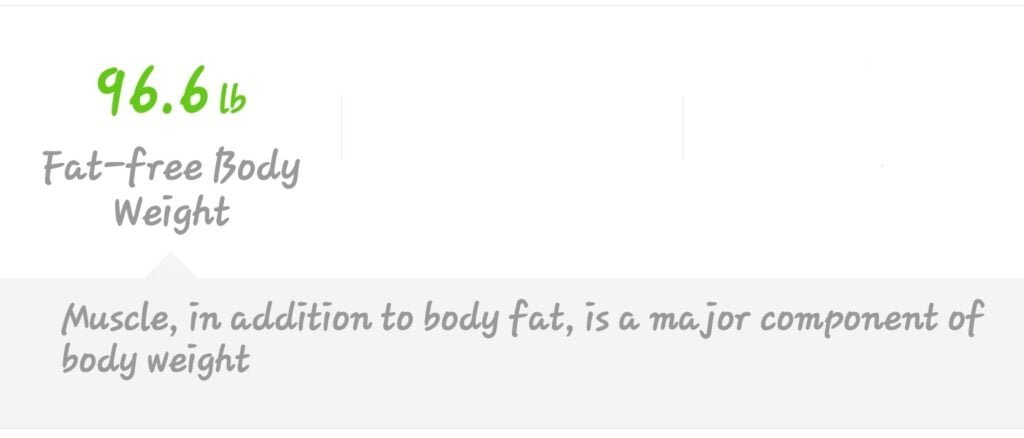
Fat free Weight
The fat-free weight is everything that is not fat. This includes the organs and bone. There is not a bag graph for this one.
Subcutaneous Fat
Subcutaneous fat is the fat that is stored right up under the skin. Subcutaneous fat is important to have, but having too much usually means that there is a disproportionate amount of visceral fat. Also, the subcutaneous fat helps to protect your insides. Check out “What Is Subcutaneous Fat?” if you would like to learn more about subcutaneous fat or visceral fat.
- Blue – Low
- Green – Standard
- yellow – High

- 18.50 and above Standard
- 26.7 and above is High
Visceral fat
Visceral fat is found under the muscle around the organs and in the abdomen cavity. As humans, we need visceral fat, but having an excessive amount of this fat has been linked to various types of diseases. One reason we need visceral fat is to help protect our organs.
- Dark Green – Good
- Light Green – Acceptable
- Yellow – High
- Red – Excessive

- 6 and above is Acceptable
- 11 and above is High
- 15 and above is Excessive
Water weight
Water weight is essentially all body fluids that give a combined percentage of water in the body. The water is a combination of lymph, extracellular, and blood. Water weight for an average healthy adult is around 50 to 60 percent.
- Blue – Low
- Green – Normal
- yellow – High
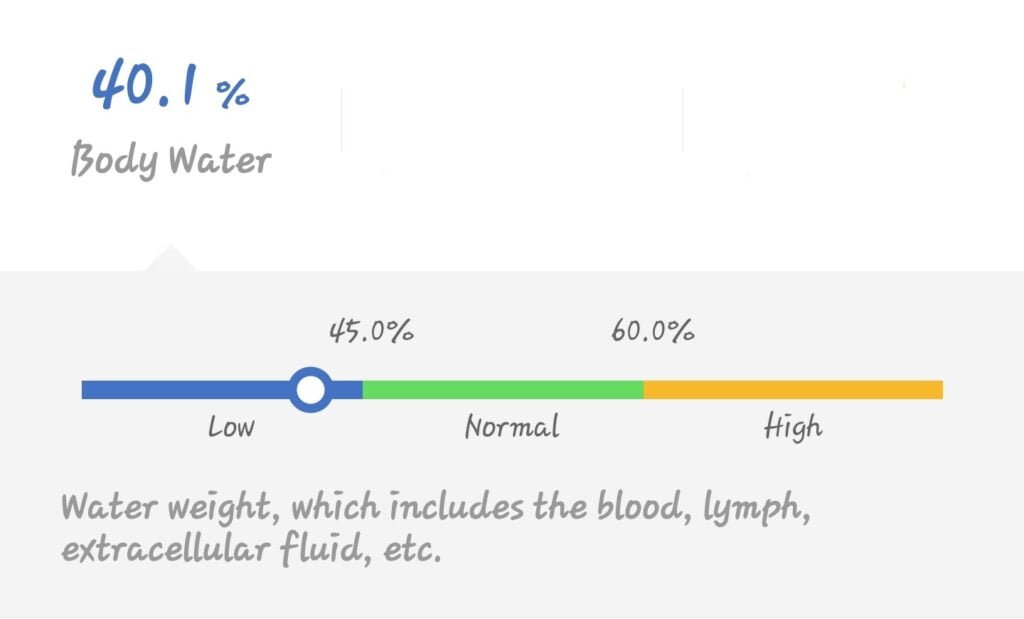
- 45.0% and below is Low
- 45.0% and above is Normal
- 60.0% and above is High
Skeletal Muscle
The skeletal muscle system works with the mechanical system of the limbs to allow movement. The skeletal muscle system consists of cartilage tendons, ligaments, bones, and connective tissue.
- Blue – Low
- Green – Standard
- yellow – High
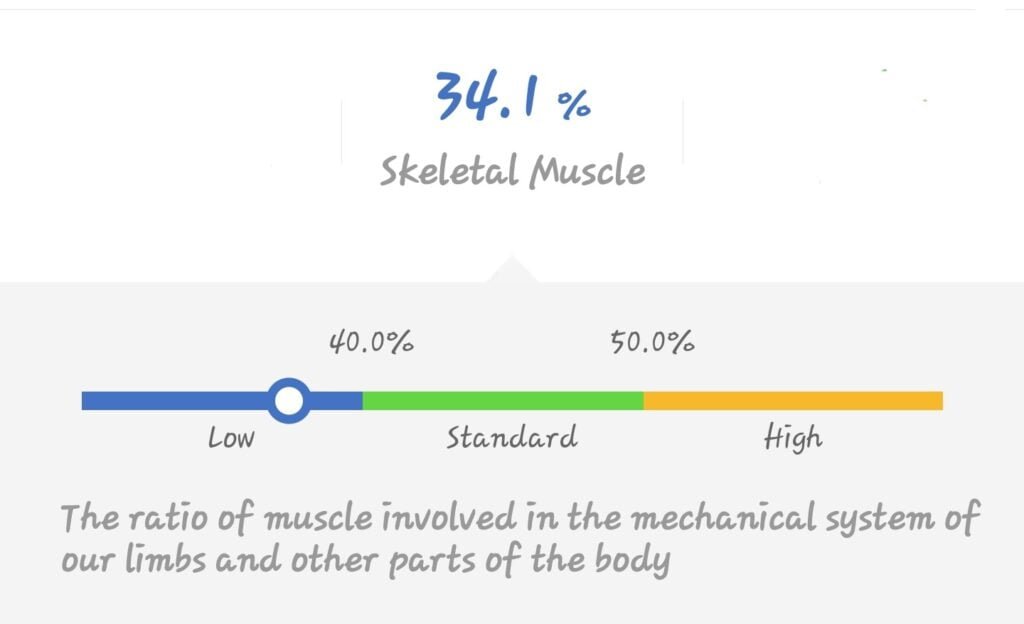
- 40.0% and above is Low
- 40.0% and above is Standard
- 50.0% and above is High
Muscle Mass
The muscle mass that is measured with the Renpho Scale is the heart, smooth muscle, skeletal muscles, and other cardiac muscles. The Renpho Scale application for muscle mass does not go by percentage, but by the pound. This puts me at 90.6lb, which is on the higher side.
- Blue- Low
- Light Green – Normal
- Dark Green – High

- 64.20lb and below is Low
- 64.20lb and above is Normal
- 76.40lb and above is High
The chart below is based off of muscle mass percentage not pounds.

Bone Mass
There are 3 types of tissue of bone, one type is a compact tissue that is the hardest part outside of the bone. Cancellous tissue is the spongy part of the inside of the bone. The 3rd is subchondral tissue, which is at the end where it is smooth and connects to cartilage. Renpho Scale measures all 3 types of bone tissue combined for the total bone mass.
- Yellow- Below Average
- Light Green – Average
- Dark Green – Above Average

- 4.20lb and below is Below Average
- 4.20lb and above is Average
- 6.60lb and above is Above Average
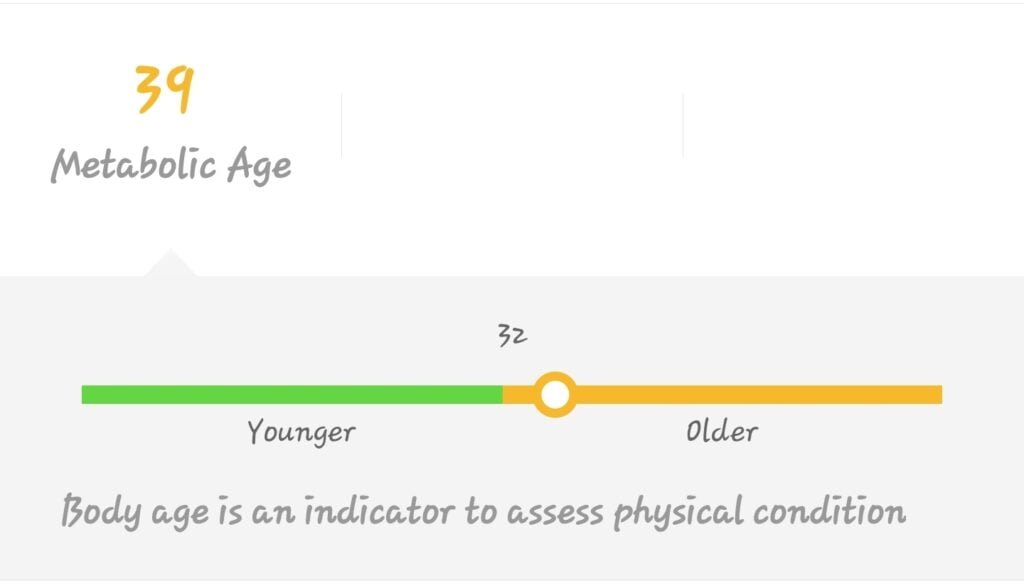
Metabolic Age
Metabolic age is based on the age of your body and your metabolism processes. The reason that we should know our metabolic age is because it is based on the health of your insides, not the number of years that you have been alive. The Renpho Scale bases the age you have in your application. For me, the green is anywhere below 32. My goal is to be 28 again Wink Wink!!
- Green – Younger
- Yellow – Older
Protein
We need there to be a sufficient amount of proteins in the body to build and maintain muscle, hormones, cells, tissue, and their growth. If you would like to know more about how proteins play a vital row in your health, then check out this article “9 Important Functions of Protein in Your Body.“
- Blue- Inadequate
- Light Green – Standard
- Dark Green – Adequate

- 14.0% and below is Inadequate
- 14.0% and above is Standard
- 16.0% and above is Adequate
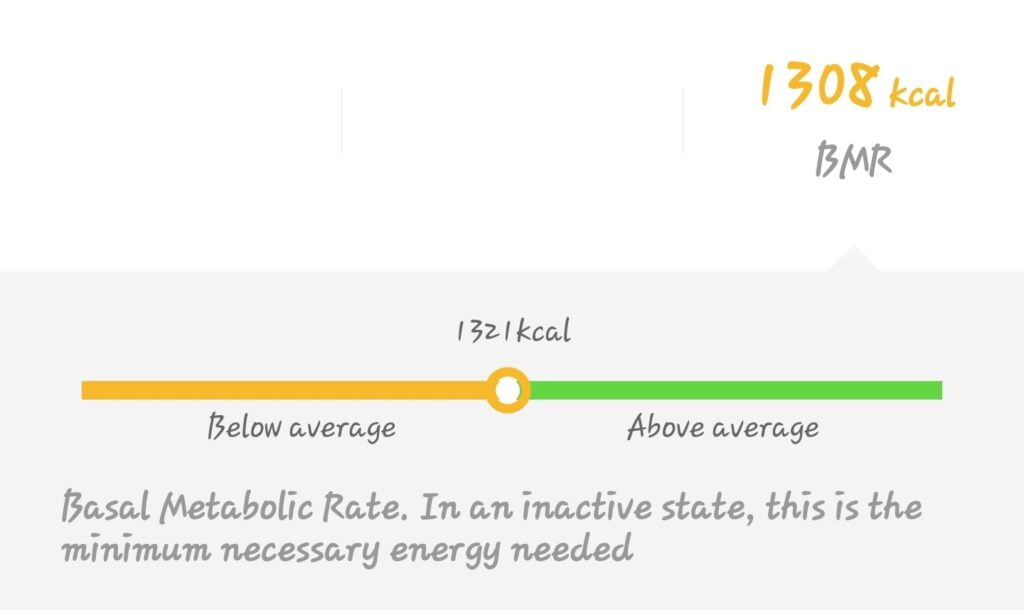
BMR (Basal Metabolic Rate)
BMR (Basal Metabolic Rate) the inactive state of energy. Even when you are not active your body has to maintain certain functions. This requires calories that can be converted to energy. Yours will look different from mine.
- Below average – Yellow
- Above-average – Green
Final Thoughts
After reading about the different categories for the Renpho Scale. I realized that a person’s health is not just based on their total weight alone. Everyone’s weight comprises of all that I have shown above. I learned we need fat, but of course, too much fat can prevent us from doing so many things in life and slowly suffocate our interior organs. Resulting in disease and possibly premature death. Overall, being overweight is never the idea for anyone. Not to mention how being overweight makes you feel. If you would like to get the application, check out my first article about the Renpho Smart Scale Review.